A helper function to plot spaghetti plots of continuous variables separated
by the clusters found by longmixr.
Usage
plot_spaghetti(
  model,
  data,
  variable_names,
  time_variable,
  show_mean_sd_ribbon = TRUE,
  number_of_clusters = 2,
  scales = "fixed"
)
Arguments
- model
lccobject (output fromlongitudinal_consensus_cluster)- data
a
data.framethat contains the variables to be plotted and the time and ID variable used in the longmixr clustering; typically the data used for the clustering- variable_names
character vector of the continuous variables to be plotted
- time_variable
the name of the variable that depicts the time point of the measurements
- show_mean_sd_ribbon
booleanif the mean and SD per variable should be shown, the default isTRUE- number_of_clusters
the number of clusters that should be plotted, the default is
2- scales
scalesargument offacet_wrap, the default isfixed
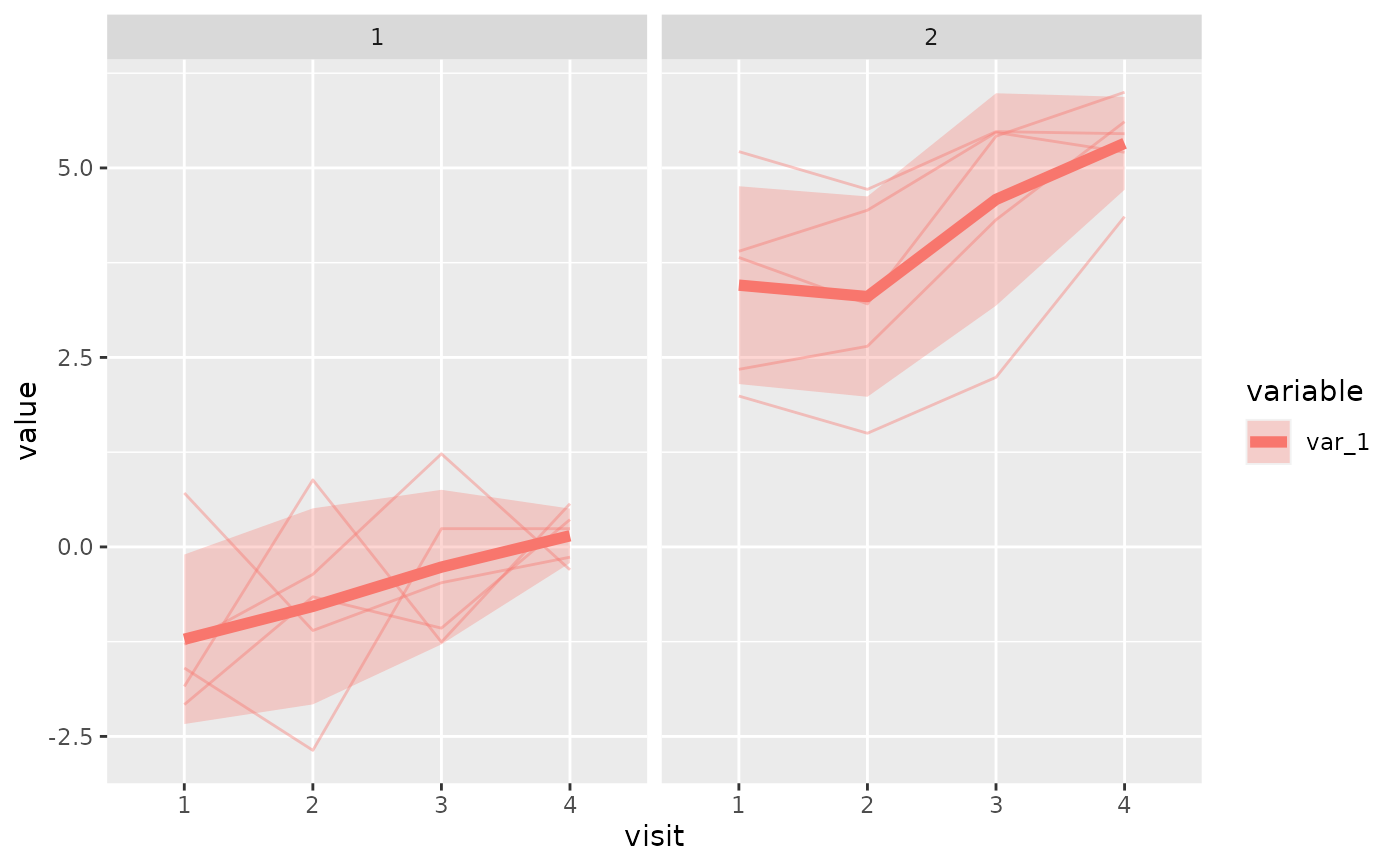
Details
The spaghetti plot shows the longitudinal trajectory (defined by
time_variable) of continuous variables separated by the clusters found
by longitudinal_consensus_cluster. The provided data.frame
for data can either be the same as used in the clustering with
longitudinal_consensus_cluster or needs to contain the same
id_column as in the clustering and a time_variable.
Examples
set.seed(5)
test_data <- data.frame(patient_id = rep(1:10, each = 4),
visit = rep(1:4, 10),
var_1 = c(rnorm(20, -1), rnorm(20, 3)) +
rep(seq(from = 0, to = 1.5, length.out = 4), 10),
var_2 = c(rnorm(20, 0.5, 1.5), rnorm(20, -2, 0.3)) +
rep(seq(from = 1.5, to = 0, length.out = 4), 10))
model_list <- list(flexmix::FLXMRmgcv(as.formula("var_1 ~ .")),
flexmix::FLXMRmgcv(as.formula("var_2 ~ .")))
clustering <- longitudinal_consensus_cluster(
data = test_data,
id_column = "patient_id",
max_k = 2,
reps = 3,
model_list = model_list,
flexmix_formula = as.formula("~s(visit, k = 4) | patient_id"))
#> 2 : *
#> 2 : *
#> 2 : *

plot_spaghetti(
  model = clustering,
  data = test_data,
  variable_names = "var_1",
  time_variable = "visit"
)